PeakSearchGUI
The module PeakSearchGUI.py is made to provide graphical tools to perform peak search and fitting. It enables also tools to get mosaic from a set of images.
Read Images and Binary files
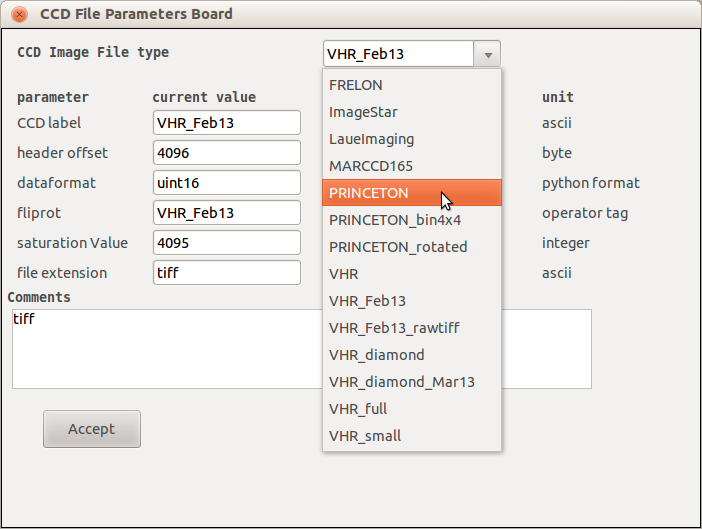
First select the detector you have used for the data collection in the menu Calibration
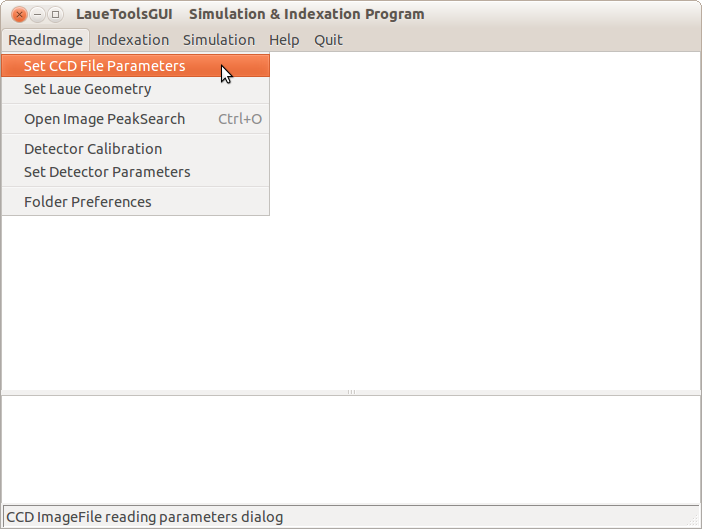
Choose the correct camera to define the binary image file parameters
View an image by selecting in the Menu File/Open Image and Peak Search.
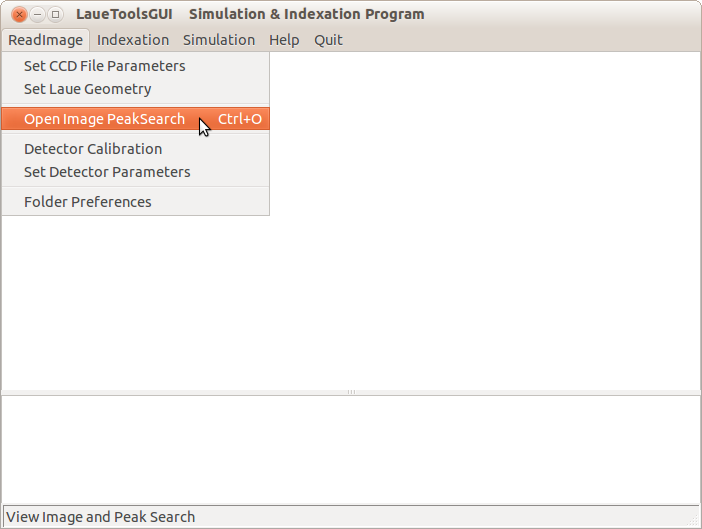
Then you obtain a board enabling to browse your set of images and to search for peaks
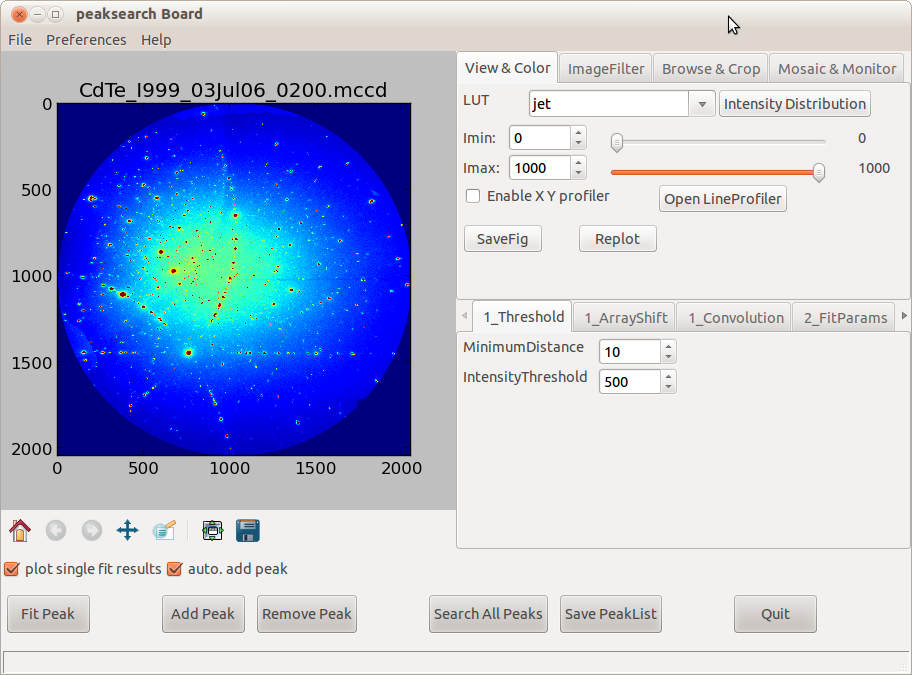
This board is composed by composed by 4 TOP tabs:
parameters of display (View & color)
Digital image processing (Image & Filter)
Browse a set of images and select a ROI (Browse & crop)
Mosaic or image-related monitor from a ROI over a set of images
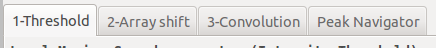
And 5 tabs at the middle
1 Selection of local maxima search Method
2 Fitting procedure parameters
3 Peaks List Manager
View & Color
This panel helps for viewing images with an appropriate color LUT, getting some infos on pixels intensity on the whole image (distribution) or along line (line profilers)
Color Mapping (LUT) of the displayed image.
ShowHistodisplays the histogram of intensity distribution (nb of pixel as a function of pixel intensity)
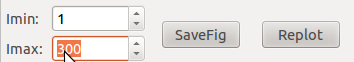
intensities limits taken into account by the LUT
Open LineProfiler: 1D plot of pixel intensities along a movable-by-user line. AndEneable X Y Profiler: 1D plot of pixel intensities along X and Y from a clicked pixel position
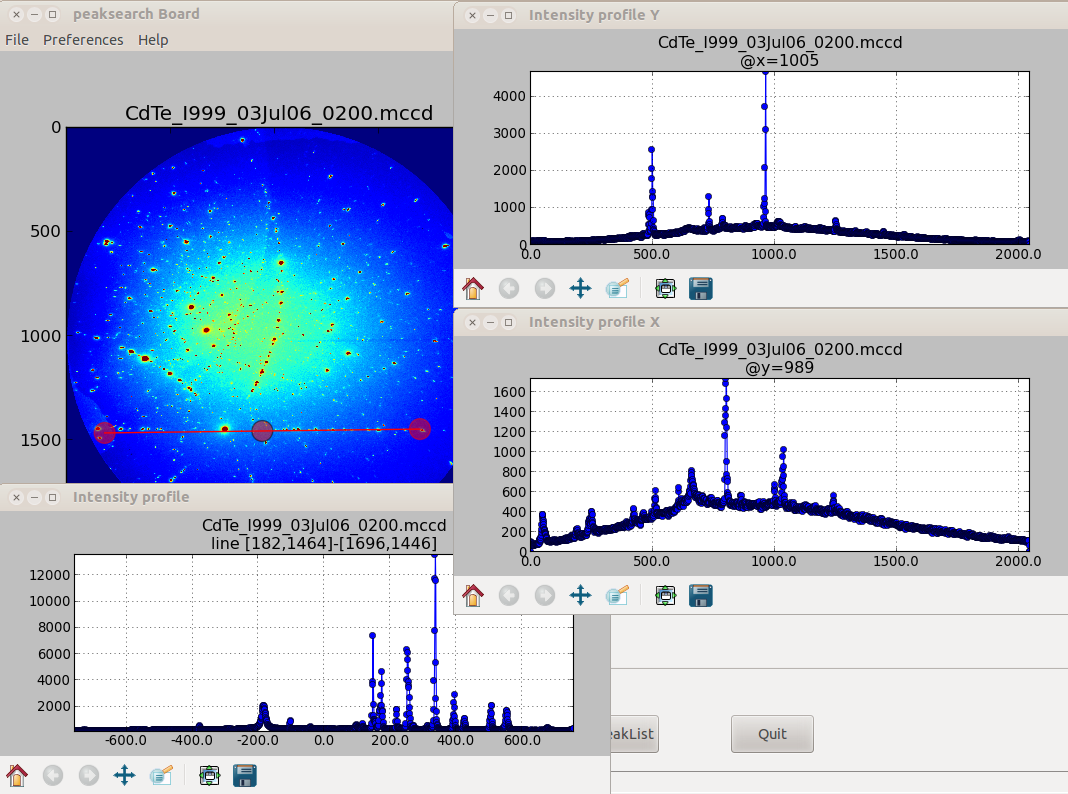
Image & Filter
This panel supplies digital image processing tools to filter current image and particularly remove background.
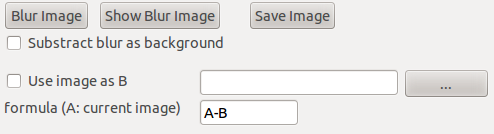
Blur Image computes the image filtered by a gaussian kernel (similar to a low pass filter). By checking Substract blur as background the raw image minus the filtered image can be displayed and used for the local maxima (blob) search.
Calculate image with A and B allows with an arithmetical formula with A (current image) and B (additional image to be open) the computation of a new image A’ on which will be performed the local maxima (blob) searchChecking. By default this image will not be used to refine the position and shape of local maxima but the former and initial A image. Check use also for fit to apply the fit procedures on pixel intensities A’.
Save results saves on hard disk the A’ image with the header contains and format of A.
Browse & Crop
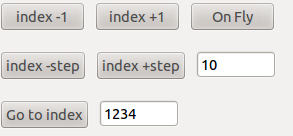
One can navigate on a set of images provided the images file name contains a numerical index with a constant prefix (e.g. myimage_0032.ccd). Navigation with button with small step index-1 and index+1 corresponds to consecutive images collected with time or along a line on sample. Navigation with button with larger step (Nb of images per line (step index)) index-10 and index+10 (for instance with larger step equals to 10) permits to look at the images collected along the direction perpendicular to the direction corresponding to the small step.
The Go To index button allows to read directly an image with an other in the same dataset. Auto index+1 button will display the next image and wait for it if it is not already in the folder.
To navigate and display faster the image when browsing on a particular region of interest (ROI) of the images, you can crop the data (CropData) by specifying the half sizes (boxsize) of the cropping box in the two directions.

Mosaic & Monitor
Several counters can be defined from pixel intensities in the same ROI (centered a clicked pixel with half box sizes given by user) over a set of images.
Mosaic: Recompose a 2D raster scan from the selected ROI of each images as a function of image index
Mean Value: plot a 1D graph or a 2D raster scan from the mean pixel value in the selected ROI of each images as a function of image index
Max Value: plot a 1D graph or a 2D raster scan from the maximum pixel value in the selected ROI of each images as a function of image index
Peak-to-peak Value (or ‘peak to valley’): plot a 1D graph or a 2D raster scan from the largest pixel amplitude value in the selected ROI of each images as a function of image index
Peak position: plot two 1D graphes of X and Y peak position of the peak in the selected ROI of each images as a function of image index
Plot Tools
The standard toolbar is provided by the graphical ‘matplotlib’ library with the following features:
A ROI can be set to zoom in the data.
This ROI can be moved easily with the pan button

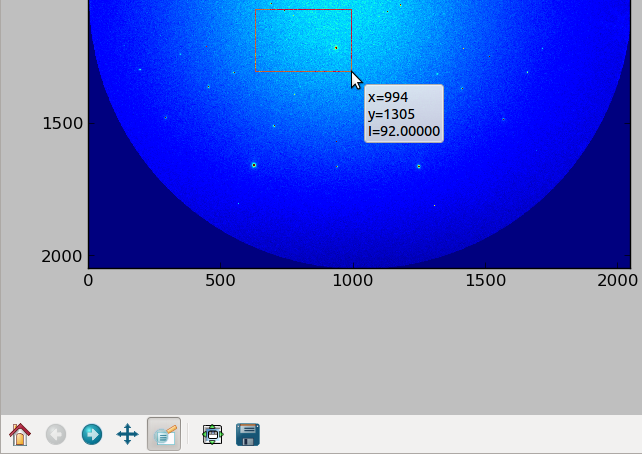
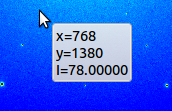
When hovering the mouse on the image pixel position and corresponding intensity are displayed
Previous selected ROIs are stored and can be recalled by arrows (
Homeicon recalls the initial full image)
Local Maxima or Blob Search
To guess the initial parameters fitting, 3 methods leads to a list of local maxima (or blobs)
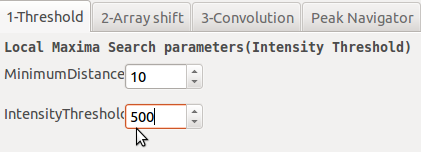
Method 1: pixels above a threshold on raw image
The basic method consists in considering every pixel higher than intensityThreshold as a local maxima pixel.
If intensityThreshold is too high you will get only few pixels at the submit of laue spots.
If intensityThreshold is too small you will too much pixels that you may stuck the software.
MinimumDistance is the smallest distance separating two local maxima.
A good habit is too check the highest background level (e.g close to the image centre) and set intensityThreshold to a larger value. But even in this case if (fluorescence) background varies a lot, you will miss peaks whose maximum intensities are below the threshold… This is why removing the background is mandatory.
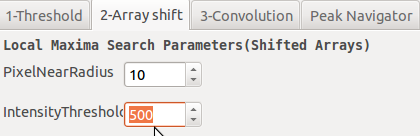
Method 2: hottest pixel in a box (by array shift)
Second Method finds the hottest pixel in a small box given by PixelNearRadius. It shifts the whole data array in 8 directions and determines every pixel hotter than the others lying in these 8 directions.
The thresholding with the IntensityThreshold level is performed on the intensity of these hot pixels with respect to local background level (set to the lowest pixel intensity in the box around the hot pixel).
One drawback of this method is that 2 hot pixels at the top of the peak but with strictly the same intensity are not detected (coincidence or more likely when peak is saturated).
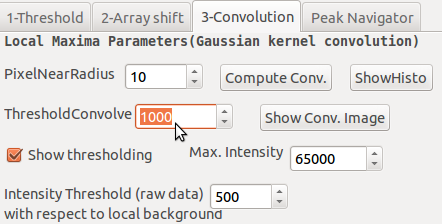
Method 3: Peak enhancement by convolution on raw image
This is the fastest method as soon as you have found the few parameters value (for batch). The Raw image data (unsigned 16 bits integers) are convolved by a 2D gaussian (mexican-hat-like) kernel. The resulting convolved Image (floats) have intense region (called blobs) where pixel intensity 2D profile on raw data is similar to the kernel intensity profile.
A first threshold with the level ThresholdConvolve (float) allows to select enhanced blob above a background. An good estimate of ThresholdConvolve value can be found by means of the pixel intensity histogram (ShowHisto): it corresponds to the (float) intensity that separates the hottest pixel population that belong to the peak (large abscisssa value) from the weakest one that belong to background.
With this blobs list, a second thresholding at Intensity Threshold (raw data) level is performed in the raw data pixel intensity with respect to local background level (like in method 2).
PixelNearRadius value enables the user to reject too much closed spots.
Max.Intensity value is used for the display of the convolved Image by clicking on Show Conv. Image. Thresholding can be visualize by checking Show thresholding.
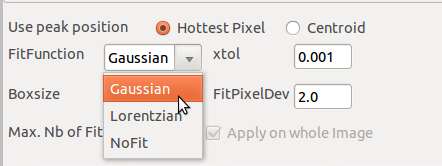
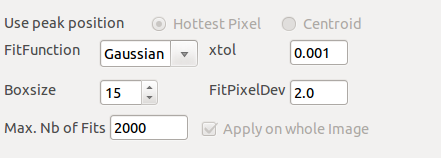
Peak Position Fit
The goal of the peak search is to have systematic values of Laue peaks and intensities. You can decide to fit or not the blob found. The Button Search All Peaks launches the local maxima chosen method and apply a fitting procedure (or not) to each found blob. A general peak list is built.
By clicking close to a Laue spot in the image and clicking on the Fit Peak button, a gaussian fit is performed. This result can be added to the current general peak list with the button Add Peak. Clicking close to a Laue spot that belongs to the peak list (blue circle marker on top of the image) and pressing Remove Peak removes the laue spot from the list.

Parameters to choose the fitting model or no fit and to reject or not the fitting result of each peak according to deviation from the initial guessed position (FitPixelDeviation).
Module functions
The next documentation comes from the docstring in the header of function or class definition.